
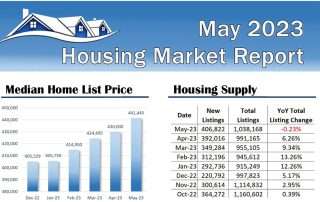
Total Home Listings Declined for First Time Since June 2022
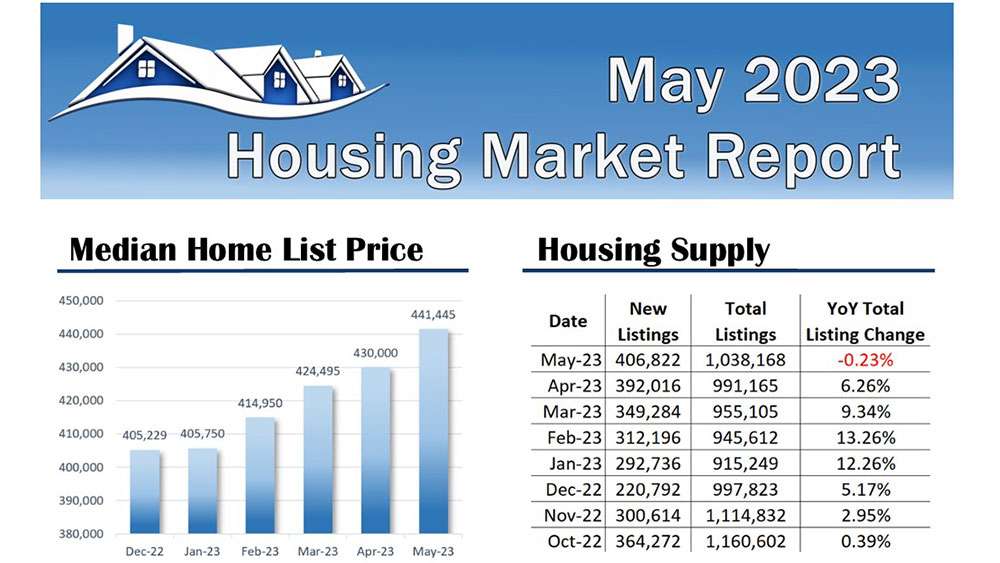
May 2023 was the first time the total number of homes listed for sale declined year-over-year since June 2022. The total decrease in May [...]
May 2023 was the first time the total number of homes listed for sale declined year-over-year since June 2022. The total decrease in May [...]
May 2023 Highlights: The number of homes for sale increased by 21.5% compared to May 2022. The total number of unsold homes (including homes [...]
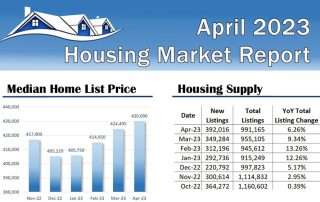
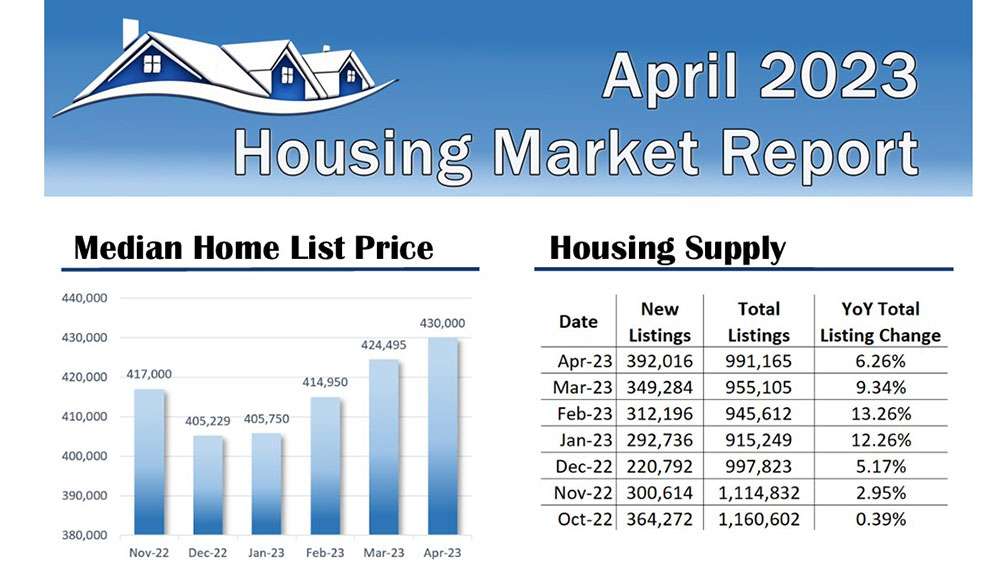
Fewer home sellers opted to put their homes on the market in April primarily due to feeling "locked in" with a lower interest rate [...]
Highlights: The number of homes actively for sale increased in April by 48.3% compared to April 2022 and up slightly (0.18%) from March 2023. [...]
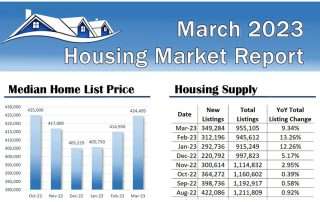
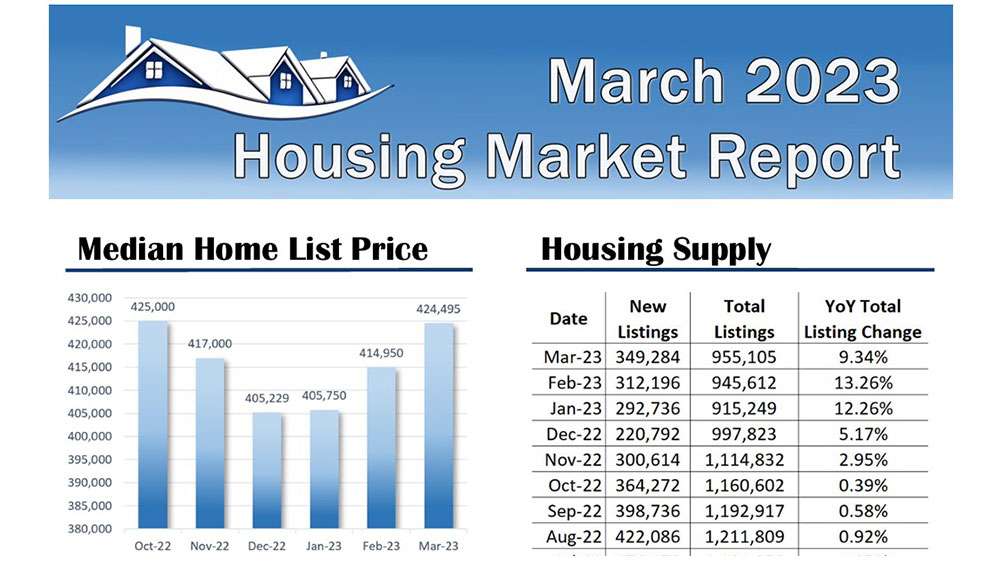
Home inventory growth slowed in March 2023 as fewer sellers put their homes up for sale than in March 2022. The March 2023 inventory [...]
Highlights The number of homes for sale increased in March by 59.89% compared to March 2022. The total number of unsold homes, including those [...]
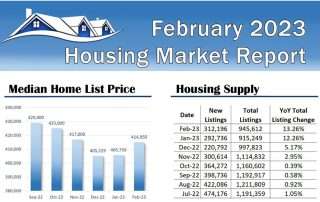
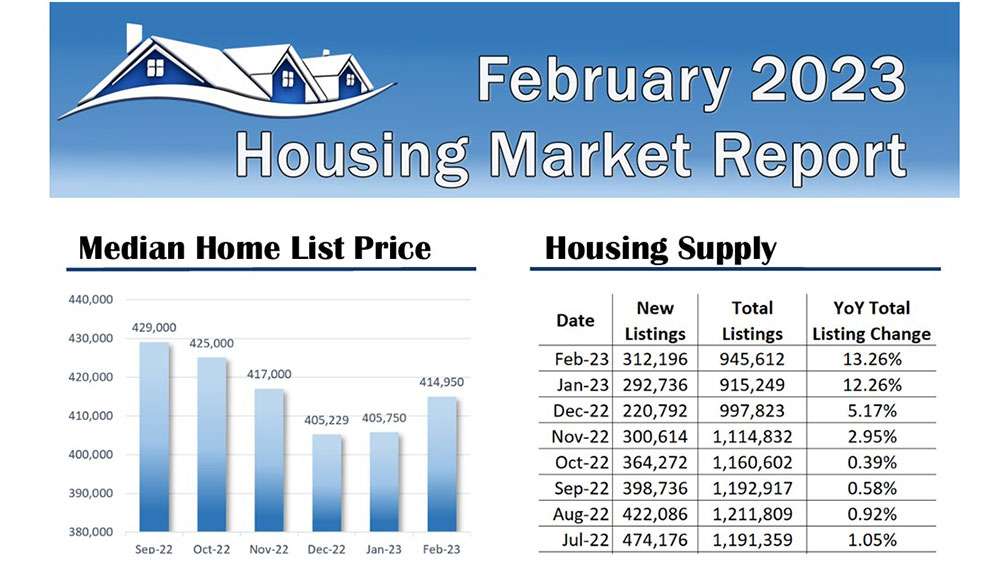
Home Inventory growth in February accelerated from January's rate due to homes spending more time on the market. In addition, the number of homes [...]
Highlights Home sellers were less active in February, with fewer homes listed for sale than in February 2022. In February, homes spent 67 days [...]
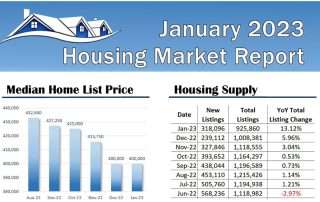
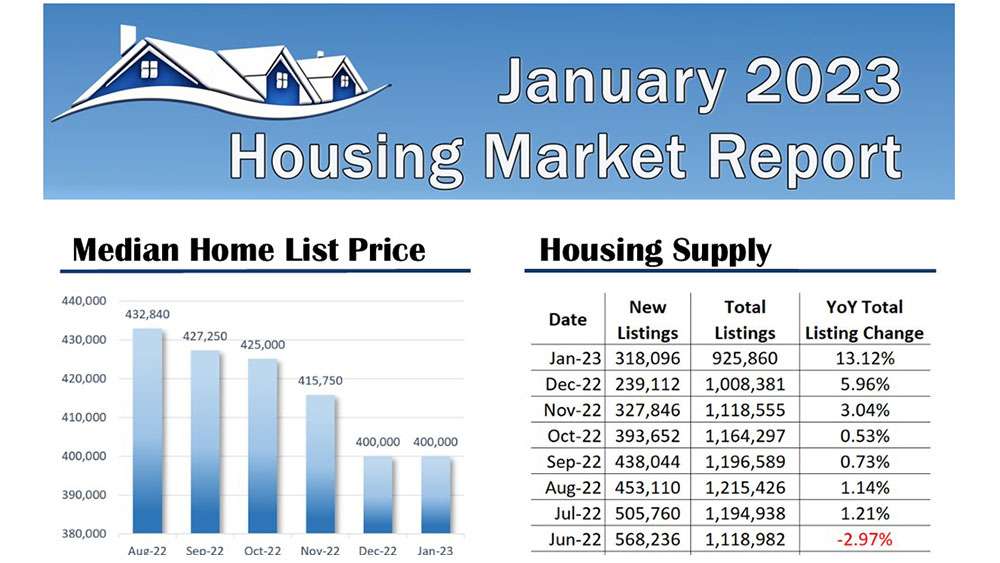
The number of homes for sale in January 2023 grew, while the time spent on the market slowed compared to January 2022. However, the [...]
Highlights Compared to January 2022, the number of homes for sale increased by 65.49%. The total number of unsold homes in January has increased [...]


